Small businesses face a multitude of challenges, from building brand awareness to converting leads into loyal customers. One of the most powerful tools at their disposal is web analytics. With the ability to track and analyze data from your website, web analytics helps small business owners gain insights into how their online presence is performing and how to make informed decisions to drive growth.
However, many small businesses may not fully understand how to harness the power of analytics. This guide will explore how you can leverage web analytics to grow your business, enhance customer experience, and optimize your marketing efforts.
What is Web Analytics?
Defining Web Analytics
Web analytics refers to the systematic process of collecting, analyzing, and reporting data related to website performance. This data typically includes quantitative metrics (e.g., pageviews, conversion rates) as well as qualitative insights (e.g., heatmaps, user behavior patterns). These analytics are used to monitor a website’s effectiveness, identify areas for improvement, and track the success of digital marketing efforts. The data is collected from a range of sources, including website visits, traffic sources, and user interactions with web content.
At a high level, web analytics can be divided into four categories:
- Descriptive analytics: Summarizes what has happened on your website (e.g., total number of visitors).
- Diagnostic analytics: Explains why something happened (e.g., a sudden drop in traffic due to a website outage).
- Predictive analytics: Anticipates future behavior based on historical data (e.g., forecasting traffic during a seasonal promotion).
- Prescriptive analytics: Recommends actions based on predictive insights (e.g., suggesting specific changes to improve conversion rates).

How Web Analytics Fits into Digital Marketing
In the context of digital marketing, web analytics serves as the backbone of data-driven decision-making. It allows marketers to monitor the performance of their campaigns, understand which channels are most effective, and optimize their efforts to maximize ROI. For example, by tracking the conversion rate of a PPC campaign, a small business owner can determine whether their ads are effectively driving sales, or whether adjustments need to be made to the ad copy, targeting, or budget allocation.
Key Metrics Tracked with Web Analytics
- Pageviews: The total number of pages viewed by visitors on your website.
- Bounce rate: The percentage of visitors who leave your website after viewing only one page.
- Session duration: The average amount of time visitors spend on your site during a single session.
- Conversion rate: The percentage of visitors who complete a desired action, such as making a purchase or signing up for a newsletter.
- Traffic sources: Where your visitors are coming from, such as search engines, social media, or direct visits.
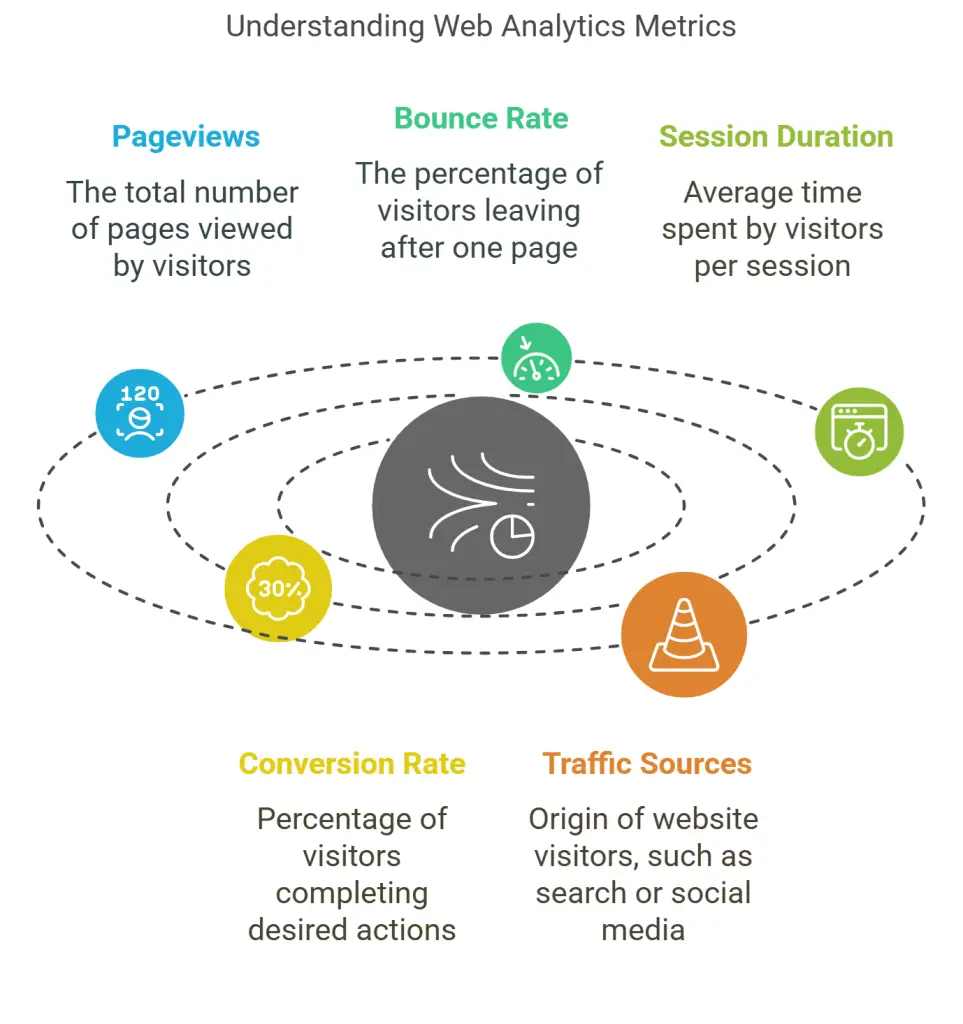
By analyzing these metrics, you can gain valuable insights into the strengths and weaknesses of your website, allowing you to make data-driven decisions that lead to business growth.
Real-Life Scenarios
Consider a small online retailer struggling with high bounce rates on their product pages. By analyzing user behavior through web analytics, they discover that many visitors are leaving due to slow page load times. Armed with this data, the retailer implements several optimizations, including compressing images and enabling browser caching. As a result, page load times improve, bounce rates decrease, and conversions increase.
Similarly, a local restaurant might use web analytics to track traffic sources. They discover that a significant portion of their website traffic comes from Instagram, prompting them to invest more resources in their social media marketing strategy. By leveraging these insights, the restaurant can attract more customers and increase online reservations.
Why is Analytics Important for Small Businesses?
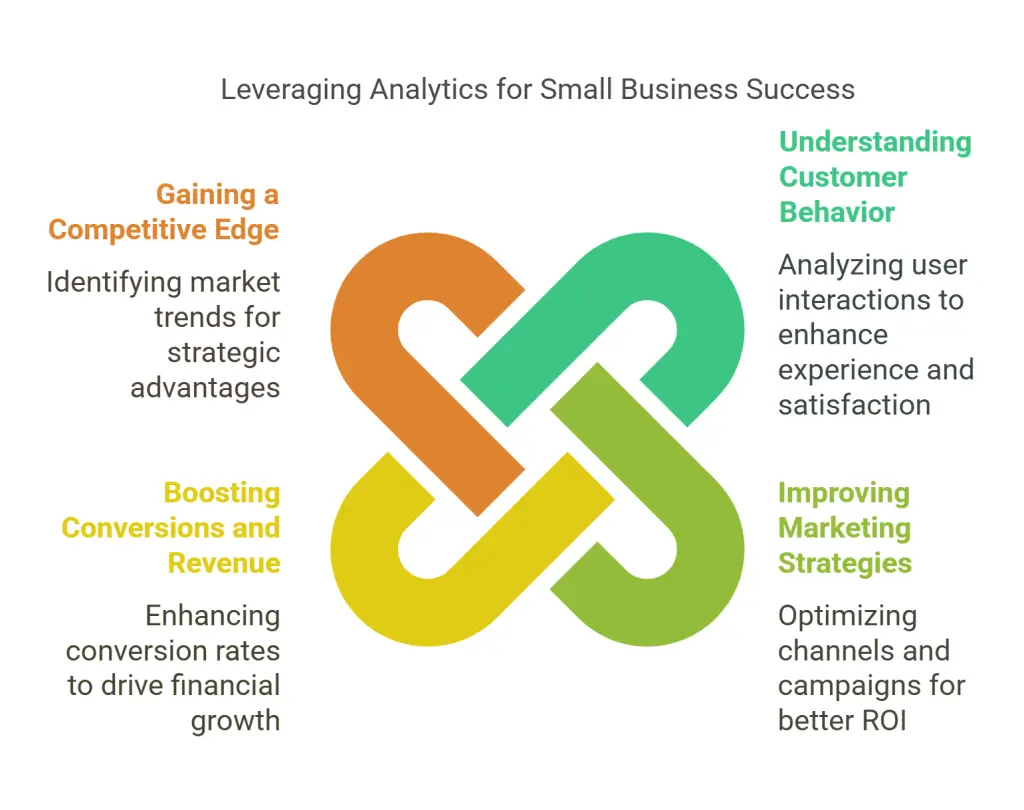
Understanding Customer Behaviour
One of the most significant benefits of web analytics is the ability to gain insights into customer behavior. By analyzing user behavior data, small businesses can identify patterns and trends that help them understand how visitors are interacting with their website. For example, you can track the paths visitors take through your site, the pages they spend the most time on, and the actions they take before converting.
These insights are invaluable for optimizing the customer experience. If analytics show that visitors are frequently abandoning the checkout process on an e-commerce site, it could indicate friction points, such as a complicated payment process or unexpected shipping costs. By addressing these issues, small business owners can improve the user experience, increase customer satisfaction, and boost conversions.
In addition to improving the overall customer experience, understanding user behavior allows businesses to tailor their marketing efforts more effectively. For instance, if analytics reveal that a significant portion of your audience is accessing your site via mobile devices, you may prioritize mobile optimization or launch mobile-specific marketing campaigns.
Improving Marketing Strategies
Web analytics also plays a critical role in shaping marketing strategies. By analyzing data on traffic sources, engagement, and conversions, small businesses can determine which marketing channels are driving the most value. This allows for more informed decision-making when it comes to allocating marketing budgets and resources.
For example, a small business running multiple marketing campaigns across social media, email, and PPC ads can use web analytics to compare the performance of each channel. By identifying the campaigns with the highest conversion rates and lowest cost per acquisition (CPA), the business can prioritize its efforts and optimize underperforming campaigns.
A/B testing is another powerful way to optimize marketing strategies using analytics. By testing different variations of landing pages, email subject lines, or ad creatives, small businesses can determine which versions perform best based on data, leading to higher conversion rates and better ROI.
Boosting Conversions and Revenue
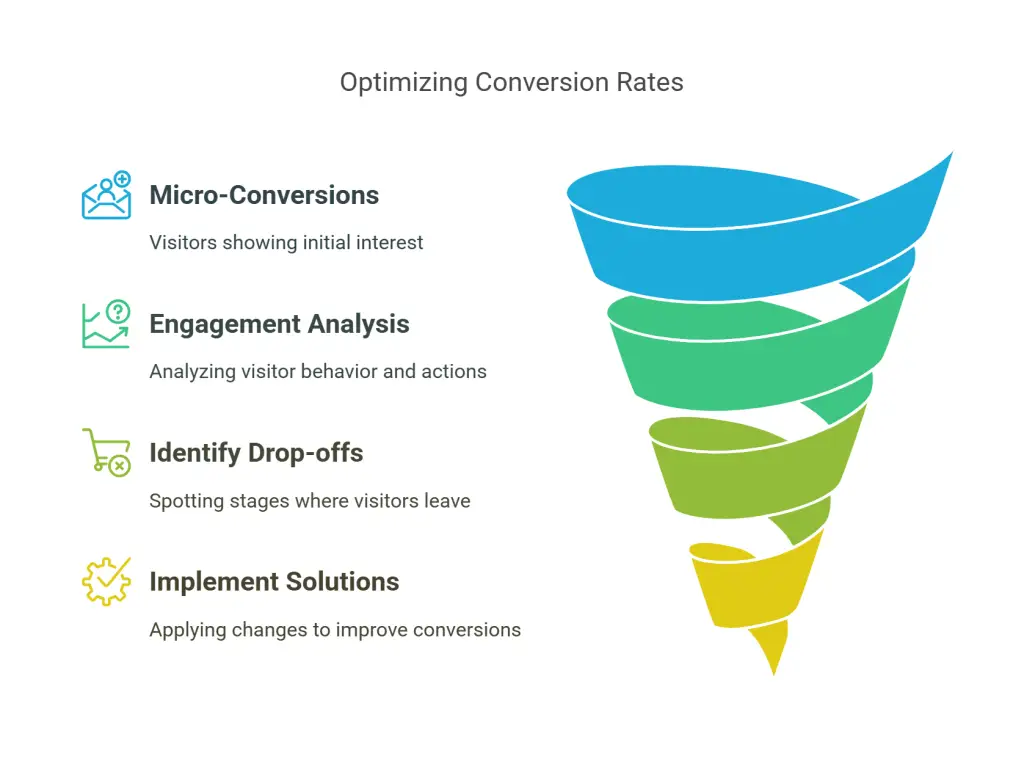
At its core, web analytics is about driving growth. By leveraging data to optimize key performance metrics like conversion rates, small businesses can directly impact their bottom line. Conversion rate optimization (CRO) involves using analytics to identify areas for improvement in the customer journey and implementing changes to increase the likelihood of visitors taking a desired action, whether that’s making a purchase, signing up for a newsletter, or filling out a contact form.
For instance, a small service-based business might notice through analytics that potential customers are dropping off at the pricing page. After reviewing the data, the business decides to simplify the pricing structure and add customer testimonials for social proof. These changes lead to a measurable increase in inquiries and bookings.
By continuously monitoring and optimizing conversion rates, small businesses can achieve sustainable growth and maximize the return on their marketing investments.
Gaining a Competitive Edge
In an increasingly competitive marketplace, small businesses need every advantage they can get. Web analytics provides a way to gain insights that can set you apart from the competition. By identifying market trends, customer preferences, and emerging opportunities, small businesses can stay ahead of the curve and make strategic decisions that fuel growth.
For example, by analyzing search engine data, a local bakery might discover that there’s growing demand for gluten-free products in their area. Armed with this insight, the bakery can introduce new gluten-free offerings, promote them through targeted marketing, and capture a new segment of customers before their competitors do.
Where Should You Focus Your Analytics Efforts?
When it comes to web analytics, small businesses often struggle with knowing where to start. With so much data available, it’s easy to get overwhelmed. However, by focusing on a few key areas, you can gain meaningful insights that drive growth.
Conversion Rates
Conversion rates are one of the most critical metrics for any business, as they directly impact revenue. A conversion occurs when a visitor completes a desired action on your website, such as making a purchase or signing up for a newsletter. Tracking and optimizing conversion rates allows you to understand how effectively your website is turning visitors into customers.
There are two types of conversions to track:
- Micro-conversions: Smaller actions that indicate a visitor’s interest in your business (e.g., signing up for a newsletter, adding a product to the cart).
- Macro-conversions: Major actions that directly contribute to your business goals (e.g., completing a purchase, booking a consultation).
By analyzing conversion data, you can identify which parts of your website are performing well and which areas need improvement. For instance, if analytics reveal that a high percentage of visitors are abandoning their carts during the checkout process, you can take steps to address potential barriers, such as simplifying the checkout flow or offering free shipping.
Traffic Sources
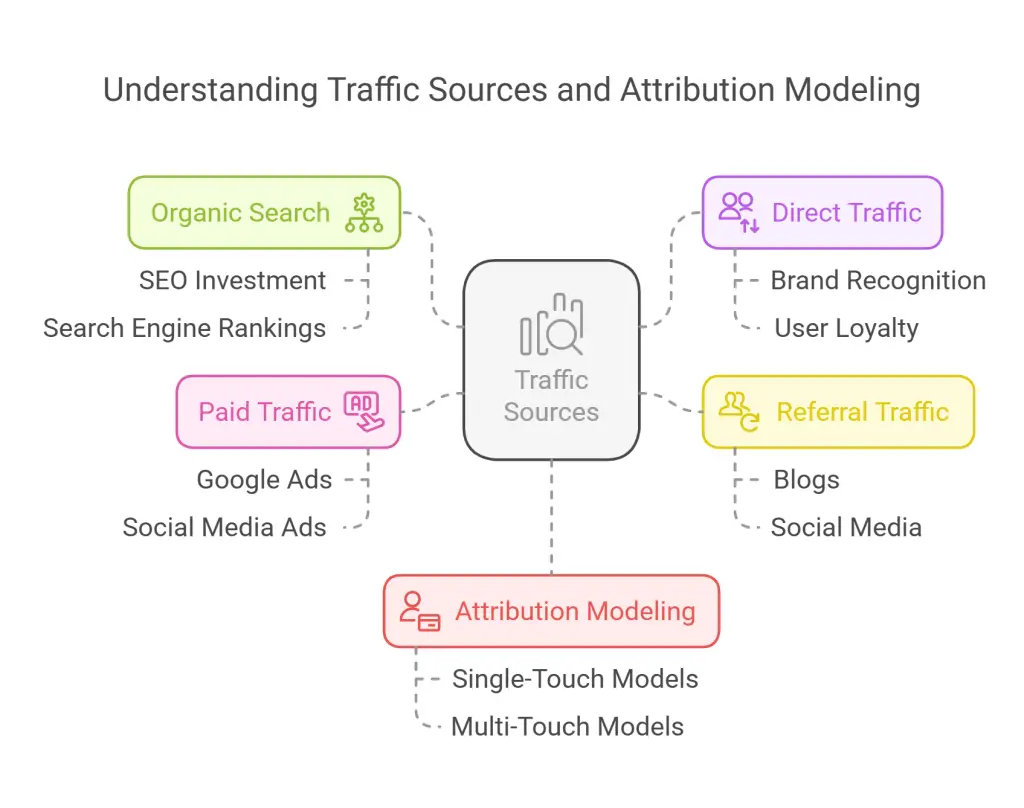
Another key area to focus on is traffic sources. Understanding where your website visitors are coming from helps you assess the effectiveness of your marketing efforts and allocate resources more strategically. Traffic sources are typically categorized into the following channels:
- Organic search: Visitors who find your website through search engines like Google.
- Direct traffic: Visitors who type your website URL directly into their browser.
- Referral traffic: Visitors who come to your website from other websites, such as blogs, directories, or social media.
- Paid traffic: Visitors who arrive at your site through paid advertising campaigns, such as Google Ads or social media ads.
By tracking traffic sources, you can determine which channels are driving the most visitors and conversions. This data helps you optimize your marketing strategies and focus on the most valuable channels. For example, if you notice that organic search is a major driver of traffic, you may want to invest more in SEO to improve your website’s rankings.
In addition to tracking traffic sources, it’s important to understand the concept of attribution modeling. Attribution modeling refers to the process of assigning credit to different marketing channels for a conversion. Single-touch attribution models (e.g., first-click or last-click) assign credit to only one channel, while multi-touch attribution models distribute credit across multiple touchpoints in the customer journey. Understanding attribution helps you accurately assess the effectiveness of your marketing campaigns and make informed decisions about budget allocation.
User Behaviour
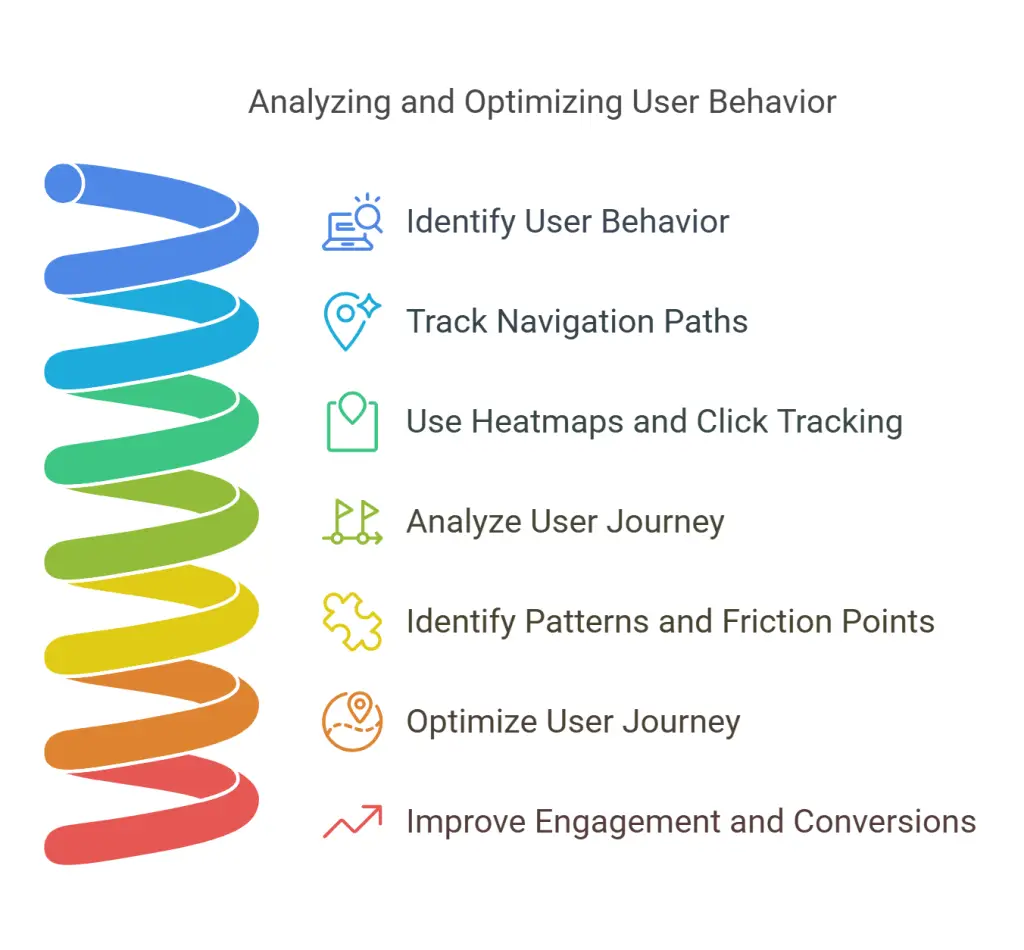
Analyzing user behaviour is essential for improving the overall user experience on your website. By tracking how visitors navigate through your site, which pages they spend the most time on, and where they drop off, you can identify areas for improvement and optimize the user journey.
Heatmaps and click tracking tools provide valuable insights into user behavior by showing which parts of your website visitors are interacting with the most. For example, heatmaps can reveal whether users are scrolling past important content or if they’re clicking on non-interactive elements. By addressing these issues, you can improve user engagement and increase the likelihood of conversions.
User journey analysis allows you to track the paths visitors take through your site, from the initial landing page to the final conversion. By identifying common patterns and friction points, you can optimize the user journey to create a smoother experience. For example, if analytics show that users are frequently exiting the site on a specific page, you can investigate the issue and make necessary improvements, such as simplifying the content or adding clearer calls-to-action.
Audience Segmentation
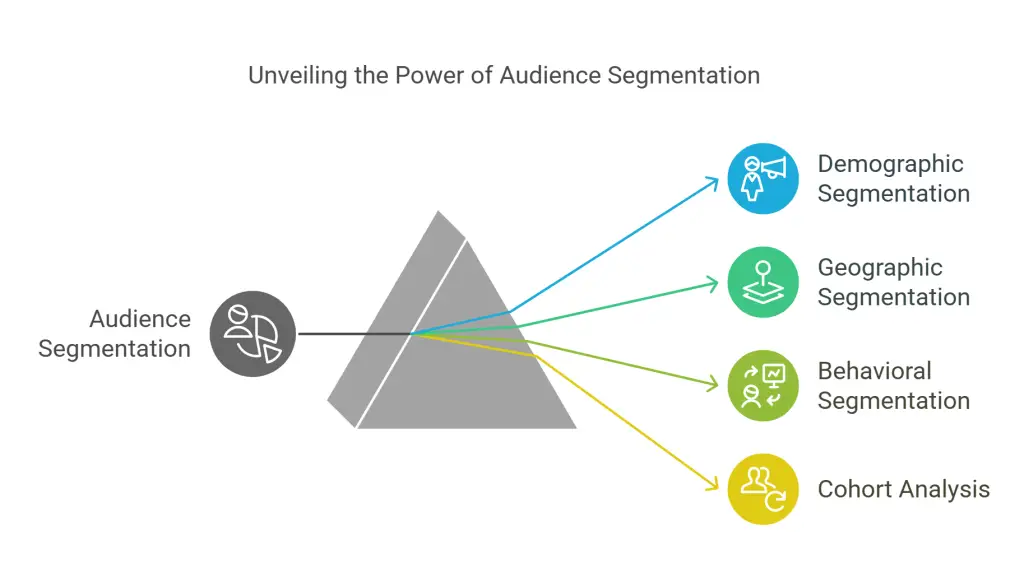
Audience segmentation involves dividing your website visitors into different groups based on specific criteria, such as demographics, location, or behavior. This allows you to tailor your messaging and marketing efforts to different segments of your audience, increasing the effectiveness of your campaigns.
For small businesses, audience segmentation is especially important because it enables you to target different customer groups with personalized offers and content. For example, an online clothing store might segment its audience based on gender and display different product recommendations for male and female visitors. Similarly, a local restaurant might use geographic segmentation to promote special offers to customers in nearby areas.
In addition to demographic segmentation, you can also use cohort analysis to track the behavior of specific groups of users over time. Cohort analysis allows you to compare how different groups of users behave after taking a particular action, such as signing up for a newsletter or making a purchase. This data can help you identify trends and make data-driven decisions to improve customer retention and engagement.
When to Analyze Data: Setting a Regular Schedule
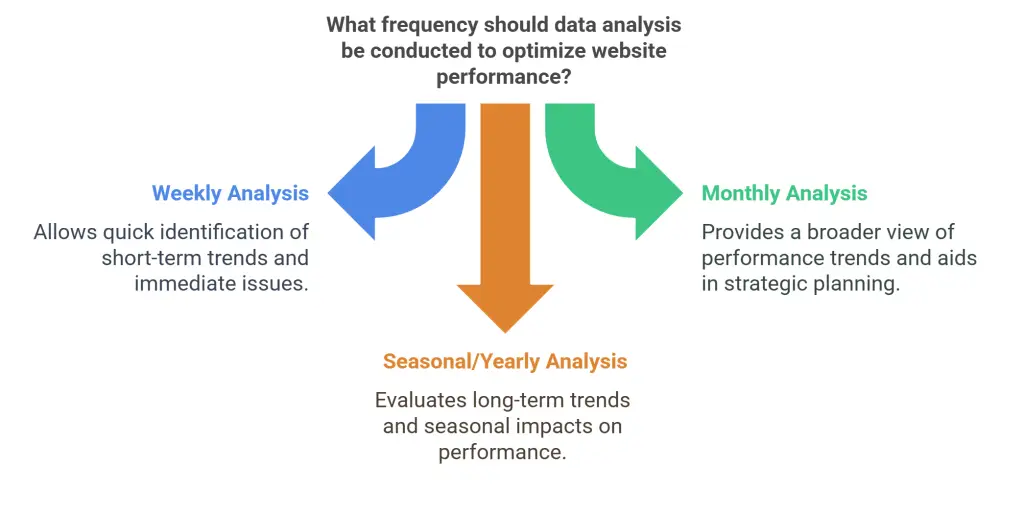
To get the most value out of web analytics, it’s essential to review your data on a regular basis. Establishing a consistent schedule for analyzing your website’s performance ensures that you’re staying on top of trends, identifying opportunities for improvement, and making informed decisions that drive growth.
Weekly Analysis
A weekly analysis allows you to monitor key performance metrics and identify any short-term trends or anomalies. During your weekly review, focus on metrics such as traffic, engagement, and conversions. By tracking these metrics on a weekly basis, you can quickly identify any issues or opportunities that require immediate attention.
For example, if you notice a sudden drop in traffic during your weekly analysis, you can investigate the cause and take action to
address it. Similarly, if you see a spike in conversions after launching a new marketing campaign, you can use this data to refine your strategy and continue driving results.
During your weekly analysis, it’s also important to review the performance of your marketing campaigns. By tracking metrics such as click-through rates (CTR), conversion rates, and cost per acquisition (CPA), you can assess the effectiveness of your campaigns and make adjustments as needed.
Monthly Analysis
While weekly analysis provides a snapshot of short-term performance, monthly analysis allows you to assess the bigger picture. By reviewing data over a longer period, you can identify trends and patterns that may not be immediately apparent in your weekly analysis.
During your monthly review, focus on evaluating the overall performance of your website and marketing campaigns. This includes reviewing key metrics such as traffic growth, conversion rates, and revenue. By comparing your performance month-over-month, you can assess whether your strategies are working and make data-driven decisions to optimize your efforts.
In addition to reviewing performance metrics, use your monthly analysis to plan for the future. For example, if you notice that a particular marketing channel is consistently driving high-quality traffic and conversions, you may decide to allocate more resources to that channel in the coming months.
Seasonal and Yearly Analysis
For many small businesses, seasonality plays a significant role in website traffic and sales. Seasonal analysis involves evaluating the performance of your website and marketing campaigns during specific times of the year, such as holidays, back-to-school season, or Black Friday. By analyzing data from previous years, you can identify trends and adjust your marketing strategies to take advantage of seasonal opportunities.
Yearly analysis, on the other hand, allows you to evaluate long-term trends and assess the overall growth of your business. During your yearly review, focus on metrics such as annual revenue growth, customer acquisition, and retention rates. By benchmarking your performance year-over-year, you can assess whether your business is on track to meet its long-term goals and make strategic adjustments as needed.
Automating Analytics Reporting
To streamline the process of analyzing data, consider automating your analytics reporting. Tools like Google Data Studio allow you to create custom dashboards that display real-time data from your website. These dashboards can be configured to show key metrics such as traffic, conversions, and revenue, making it easy to monitor performance at a glance.
By automating your reporting, you can save time and ensure that you’re consistently reviewing your data. Custom dashboards also allow you to track the metrics that matter most to your business, helping you make data-driven decisions more efficiently.
Case Study: Leveraging Analytics for Growth at Mama Rosa’s Pizzeria
Background:
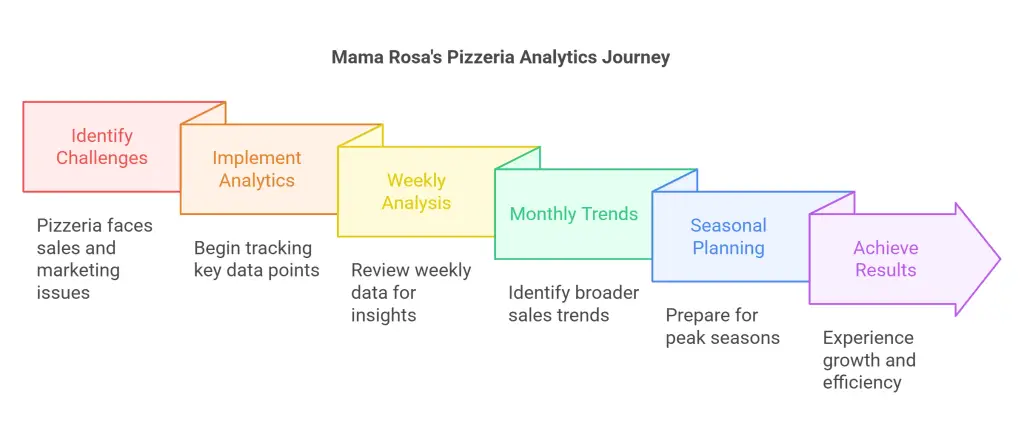
Mama Rosa’s Pizzeria, a family-owned business nestled in an inner-city district, has been serving authentic, hand-tossed pizzas for over a decade. Despite its loyal customer base, the pizzeria faced challenges with fluctuating sales, unpredictable foot traffic, and rising ingredient costs. To address these issues, the owners decided to integrate regular analytics reviews into their operations.

The Challenge:
The pizzeria struggled with inconsistent revenue, especially during weekdays. Additionally, promotional efforts were hit-or-miss, and the family had little insight into which marketing strategies or menu items were driving sales.
Implementing Analytics:
Mama Rosa’s began by tracking key data points:
- Daily Sales Metrics: Sales were monitored daily to identify peak hours and slow periods.
- Customer Preferences: Data was collected on best-selling items, customer demographics, and order preferences.
- Marketing Campaign Performance: They tracked the impact of local flyer distributions, social media promotions, and special offers.
Weekly Analysis:
Each week, the family reviewed sales data to assess the performance of new menu items and promotions. For example, after launching a midweek “Buy One, Get One Free” offer, they discovered a 20% increase in weekday sales. However, analysis revealed that while foot traffic increased, profit margins dipped. They adjusted the offer to “Buy One, Get One Half Off,” which maintained customer interest while preserving profitability.
Monthly Trends:
By reviewing monthly data, Mama Rosa’s identified broader trends. They noticed a spike in pizza orders during the colder months and higher demand for lighter menu items like salads and wraps during summer. This insight allowed them to adjust inventory, reducing waste and ensuring popular items were always in stock.
Seasonal Planning:
Analyzing data from previous years helped the pizzeria prepare for seasonal peaks. They noticed a significant increase in orders during local school events and sports tournaments. As a result, they scheduled additional staff and launched targeted promotions during these periods, boosting both efficiency and sales.

Results:
- Revenue Growth: Regular analytics reviews contributed to a 25% increase in annual revenue.
- Optimized Marketing: Targeted promotions based on data insights improved the ROI on marketing spend.
- Operational Efficiency: Better inventory management reduced food waste by 15%.
Conclusion:
Mama Rosa’s Pizzeria transformed from a struggling local eatery into a thriving business by leveraging data analytics. Regular reviews helped the family make informed decisions, optimize operations, and better connect with their community. This case illustrates how even small businesses in challenging environments can drive growth through data-driven strategies.
How to Get Started with Web Analytics Tools
For small businesses just getting started with web analytics, the process can seem daunting. However, with the right tools and a clear plan, it’s easier than you might think to begin tracking data and using it to improve your website’s performance.
Introduction to Web Analytics Tools
There are a wide variety of web analytics tools available, ranging from free options like Google Analytics to paid platforms like Adobe Analytics. The right tool for your business will depend on your needs, budget, and technical expertise.
Google Analytics
Google Analytics is one of the most popular and widely used web analytics tools, and it’s free to use. It offers a comprehensive set of features that allow small businesses to track key metrics, analyze user behavior, and monitor the performance of their marketing campaigns.
Setting Up Google Analytics
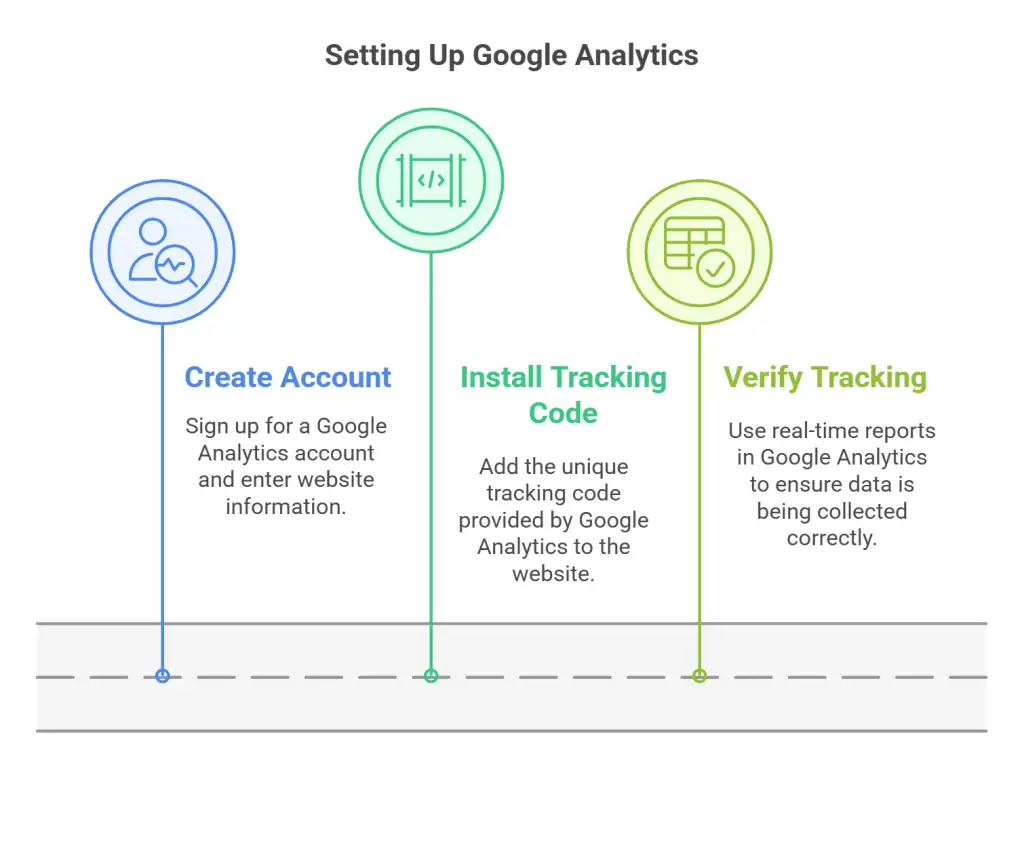
To get started with Google Analytics, follow these steps:
- Create an Account: Sign up for a Google Analytics account and enter your website’s information.
- Install the Tracking Code: Google Analytics provides a unique tracking code that you’ll need to add to your website. This code collects data from your visitors and sends it to your Google Analytics account.
- Verify Tracking: After installing the tracking code, use the real-time reports in Google Analytics to verify that data is being collected correctly.
Once your Google Analytics account is set up and tracking data, you can start exploring the various reports and dashboards available. The Audience, Acquisition, Behavior, and Conversions reports are particularly useful for small businesses, as they provide insights into your website’s traffic, user behavior, and conversion performance.
Advanced Setup Techniques
For businesses looking to take their analytics to the next level, there are several advanced techniques that can provide even deeper insights. For example, you can use Google Tag Manager to set up custom events and track specific user interactions, such as form submissions, button clicks, or video views.
Enhanced eCommerce tracking is another powerful feature available in Google Analytics. This feature allows you to track detailed data about your online store’s performance, including product impressions, add-to-cart actions, and completed transactions. By enabling enhanced eCommerce tracking, you can gain valuable insights into your customers’ shopping behavior and optimize your store for higher sales.
Interpreting Data
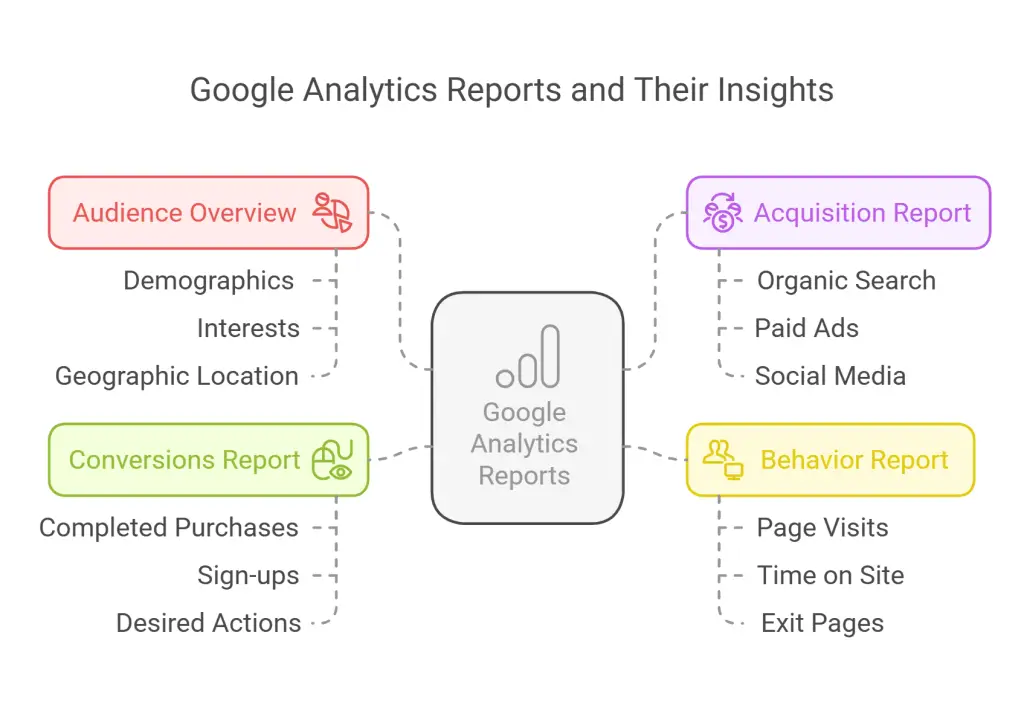
Interpreting the data collected by your analytics tools is crucial for making informed decisions. Google Analytics provides a variety of reports that can help you understand your website’s performance, including:
- Audience Overview: Provides an overview of your website’s visitors, including demographics, interests, and geographic location.
- Acquisition Report: Shows how visitors are finding your website, whether through organic search, paid ads, social media, or other channels.
- Behavior Report: Tracks how visitors interact with your website, including which pages they visit, how long they stay, and where they exit.
- Conversions Report: Tracks the performance of your goals and conversions, including completed purchases, sign-ups, or other desired actions.
By regularly reviewing these reports, you can gain valuable insights into your website’s performance and make data-driven decisions to improve your business.
Common Mistakes and How to Avoid Them
When setting up and using web analytics, it’s important to avoid common mistakes that can lead to inaccurate data or misleading insights. Some common mistakes include:
- Not setting up goals: Without goals in place, it’s difficult to track conversions and measure success.
- Focusing on vanity metrics: Metrics like pageviews or social media followers can be misleading if they don’t directly contribute to your business goals.
- Failing to ensure data accuracy: Make sure your tracking code is installed correctly and that you’re filtering out spam traffic to ensure your data is accurate.
By avoiding these mistakes and focusing on actionable insights, you can make the most of your web analytics data and use it to drive growth for your business.
Actionable Tips for Optimizing Your Website Based on Analytics
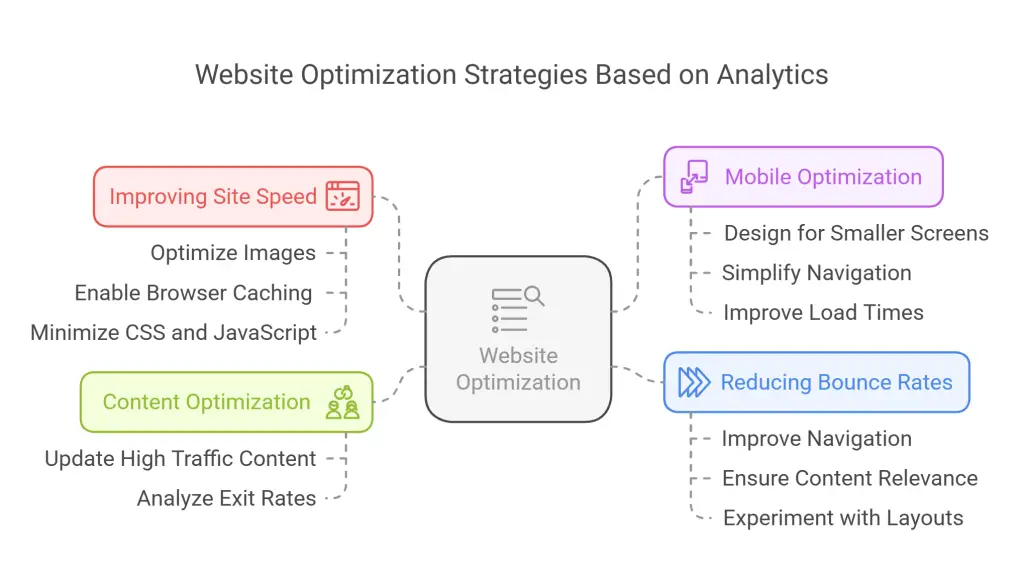
Web analytics isn’t just about tracking data – it’s about using that data to optimize your website and improve performance. Here are some actionable tips for optimizing your site based on insights from your analytics:
Improving Site Speed
Site speed is a critical factor for both user experience and SEO. If your analytics data shows that users are bouncing from your site due to slow load times, it’s time to take action. Use tools like Google PageSpeed Insights to identify areas for improvement, such as optimizing images, enabling browser caching, or minimizing CSS and JavaScript files.
Mobile Optimization
With more users accessing websites on mobile devices than ever before, it’s essential to ensure that your site is mobile-friendly. If your analytics data shows a high bounce rate for mobile visitors, consider making improvements to your site’s mobile responsiveness. This could include optimizing your site’s design for smaller screens, simplifying navigation, or improving load times on mobile devices.
Content Optimization
By analyzing which content performs best on your website, you can identify opportunities for optimization. For example, if your analytics data shows that certain blog posts are driving a lot of traffic but have a high bounce rate, you may want to update the content to make it more engaging or relevant to your audience. Similarly, if certain pages have a high exit rate, you can analyze the content and calls-to-action to make improvements.
Reducing Bounce Rates
High bounce rates can be a sign that visitors aren’t finding what they’re looking for on your site. To reduce bounce rates, consider improving your site’s navigation, ensuring that your content is relevant to your audience, and making it easy for visitors to find the information they need. You can also experiment with different layouts, headlines, and calls-to-action to see what resonates best with your audience.
Conclusion
Web analytics is an essential tool for small businesses looking to grow their online presence and achieve long-term success. By tracking key metrics, analyzing user behavior, and making data-driven decisions, small businesses can optimize their websites, improve their marketing strategies, and boost conversions.
While the process of setting up and using web analytics may seem complex at first, the benefits far outweigh the challenges. With the right tools and a consistent schedule for reviewing your data, you can gain valuable insights that help you make informed decisions and drive growth for your business.
Whether you’re just getting started with web analytics or looking to take your data analysis to the next level, the key is to stay focused on your goals and use data to guide your decisions. By leveraging the power of web analytics, small businesses can unlock new opportunities for growth and achieve sustained success in an increasingly competitive digital landscape.
Further reading
Google. “About Web Analytics.” Last accessed February 4, 2025. https://support.google.com/analytics/answer/9304153?hl=en.
Digital Marketing Institute. “Web Analytics.” Last accessed February 4, 2025. https://digitalmarketinginstitute.com/resources/lessons/analytics_web-analytics_qjyk.
Smart Insights. “Web Analytics Strategy.” Last accessed February 4, 2025. https://www.smartinsights.com/goal-setting-evaluation/web-analytics-strategy/.
TechTarget. “Web Analytics.” Last accessed February 4, 2025. https://www.techtarget.com/searchbusinessanalytics/definition/Web-analytics.
Skillfloor. “Web Analytics in Digital Marketing.” Last accessed February 4, 2025. https://skillfloor.com/blog/web-analytics-in-digital-marketing.
The Knowledge Academy. “Benefits of Web Analytics.” Last accessed February 4, 2025. https://www.theknowledgeacademy.com/blog/benefits-of-web-analytics/.
Google Developers. “Google Analytics for Beginners.” Last accessed February 4, 2025. https://developers.google.com/analytics/learn/beginners.


